Forecast Analysis Internal Tool

This project is password protected

Work My Design Process Resume

Forecast Analysis

ROLE

Primary UX Designer

DURATION

July 2024 - Feb 2025

TOOL

Figma, Data Visualization

TEAM

Product Manager, UX Designers, Engineers, Stakeholders

LONG STORY SHORT

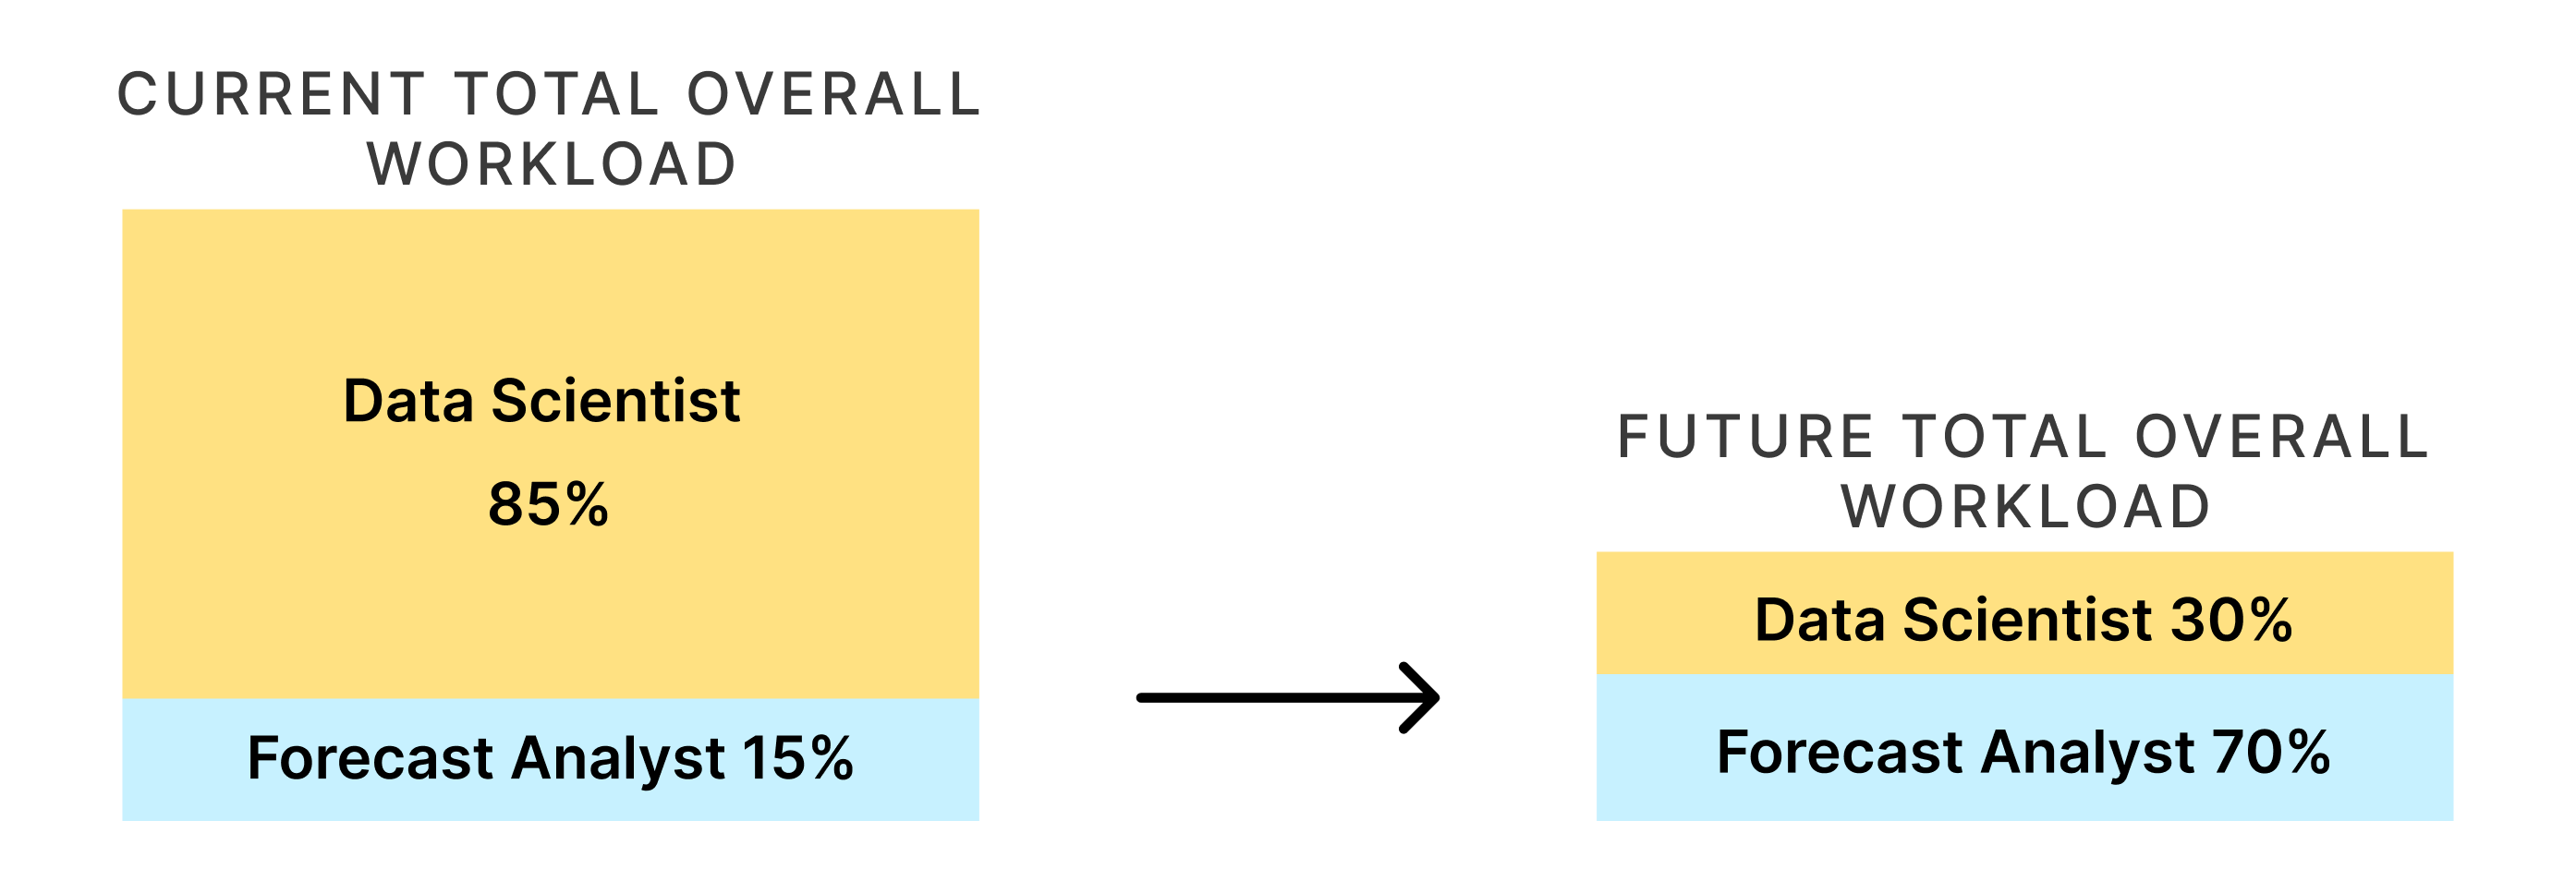
How can we remove the dependency between Forecast Analysts and Data Scientists so Analysts can work independently?

Currently Forecast Analysts are dependent on data scientists to perform their core responsibilities.

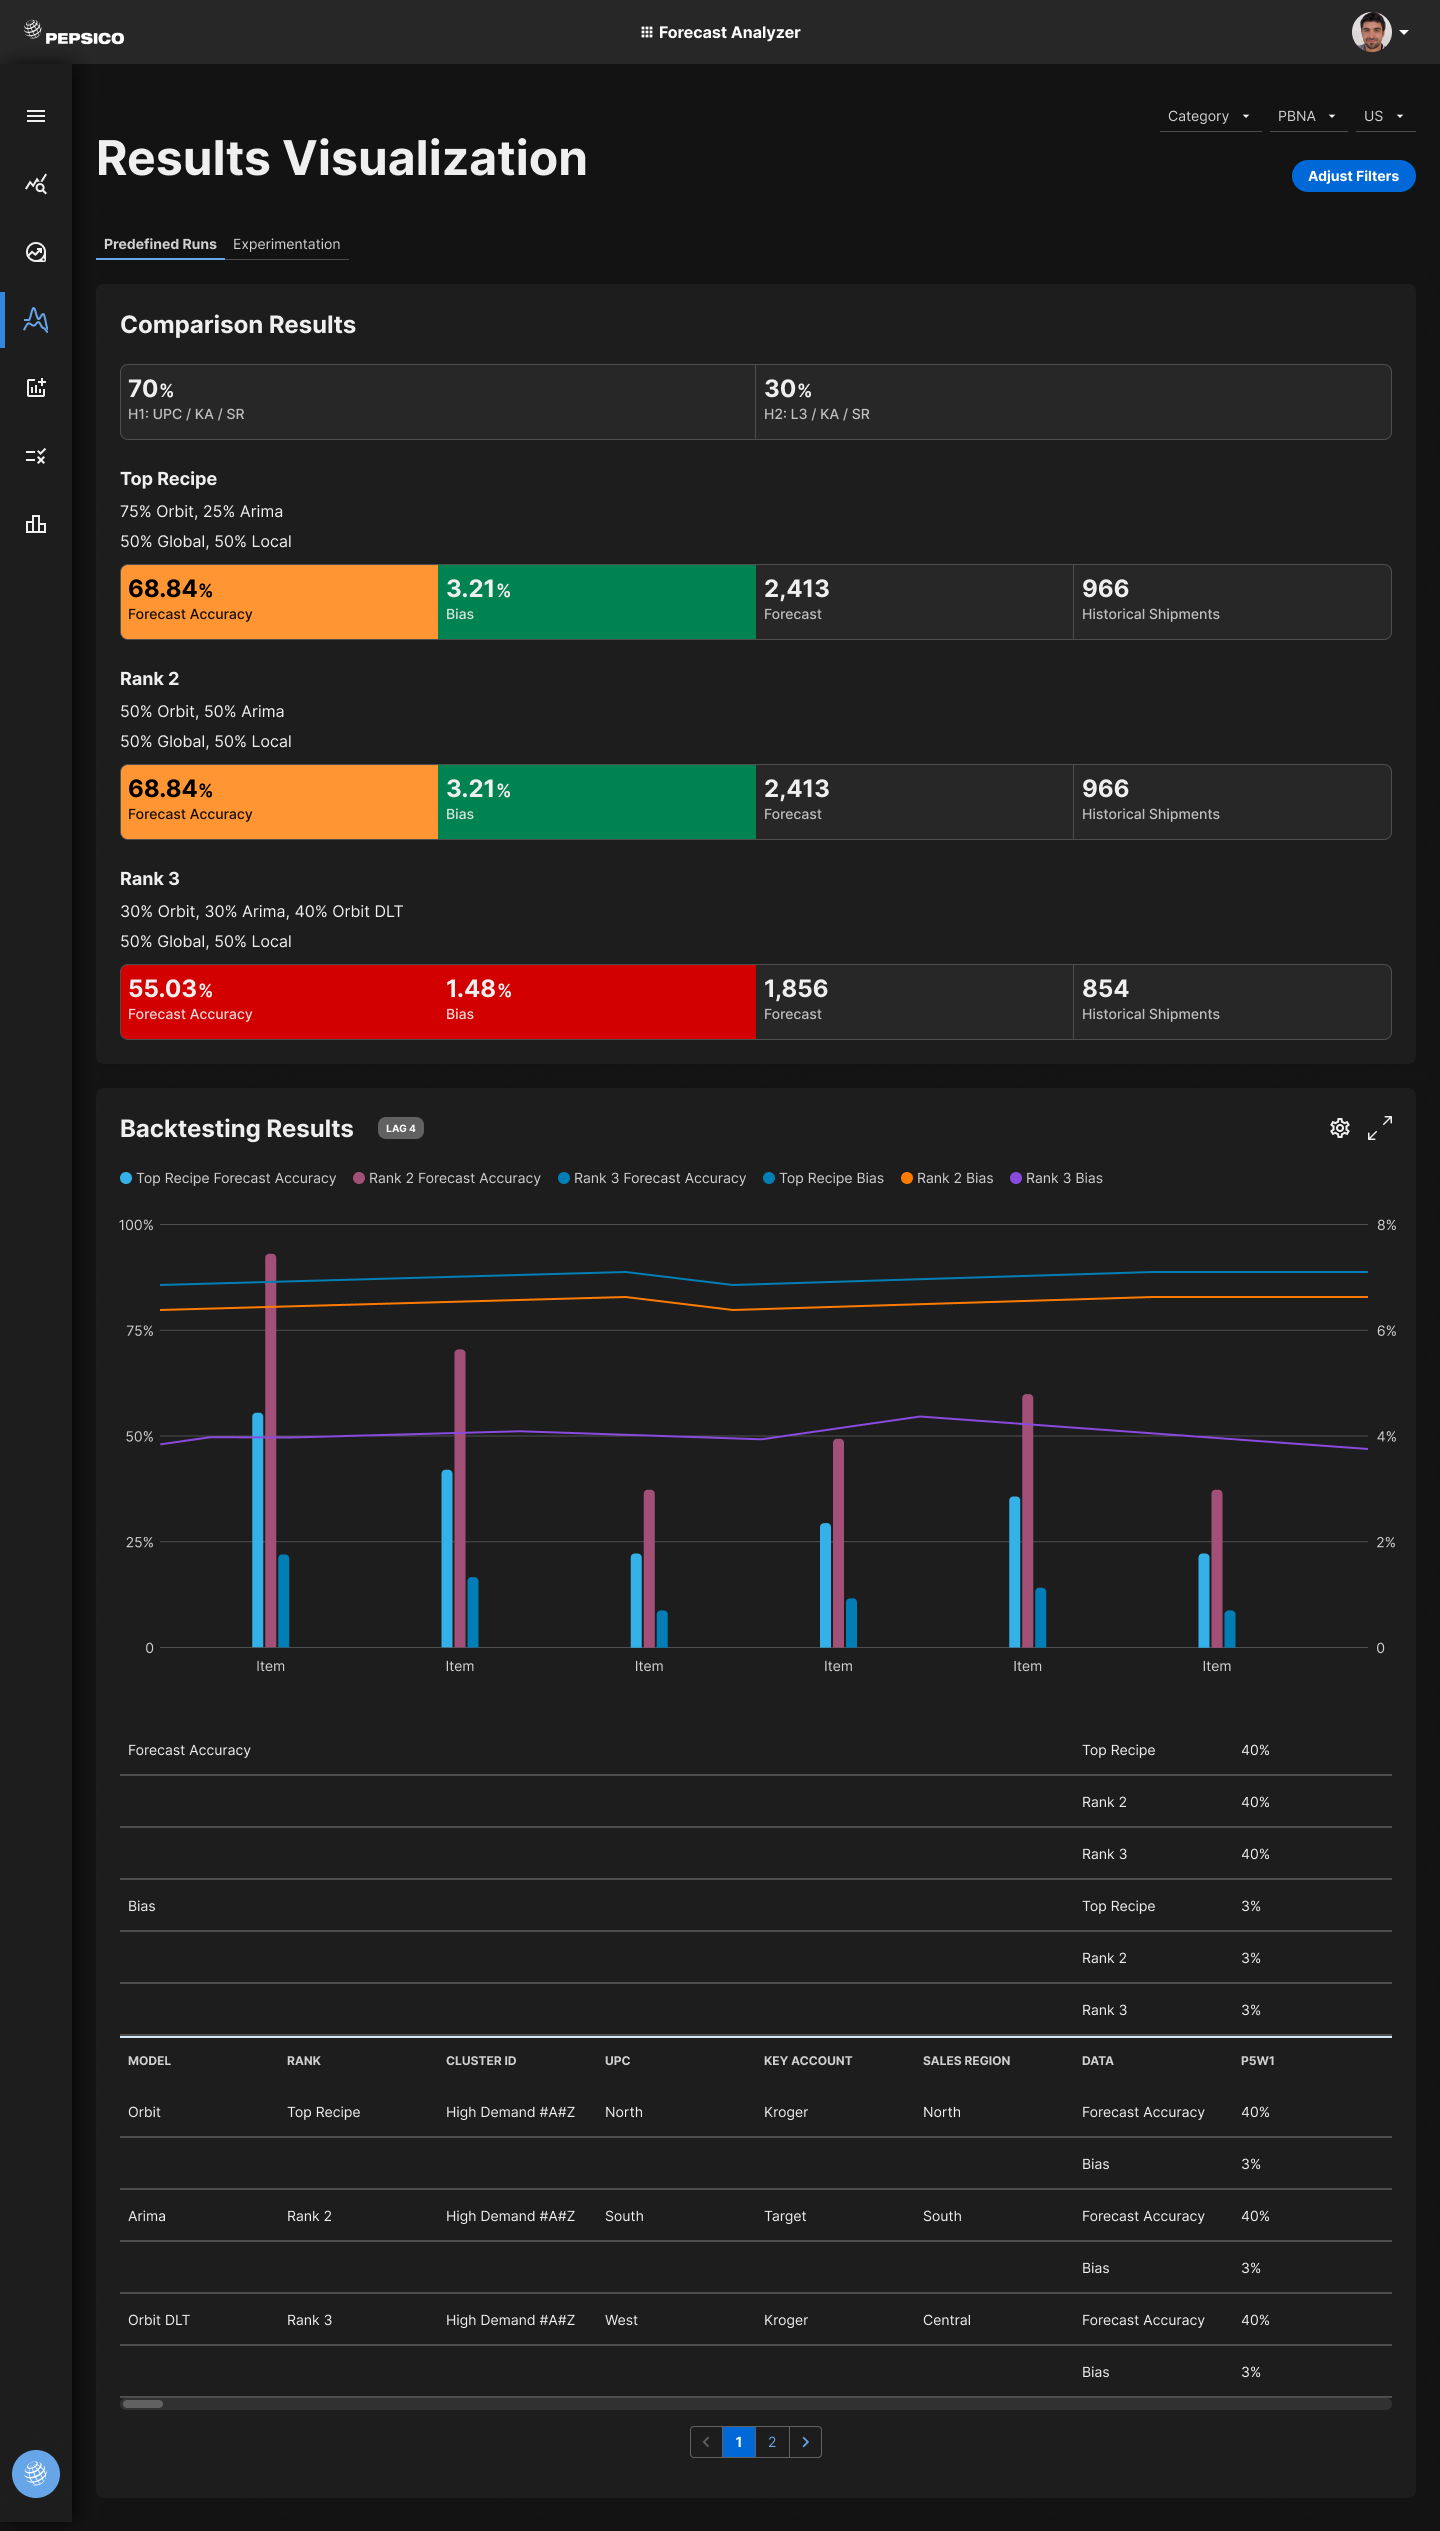
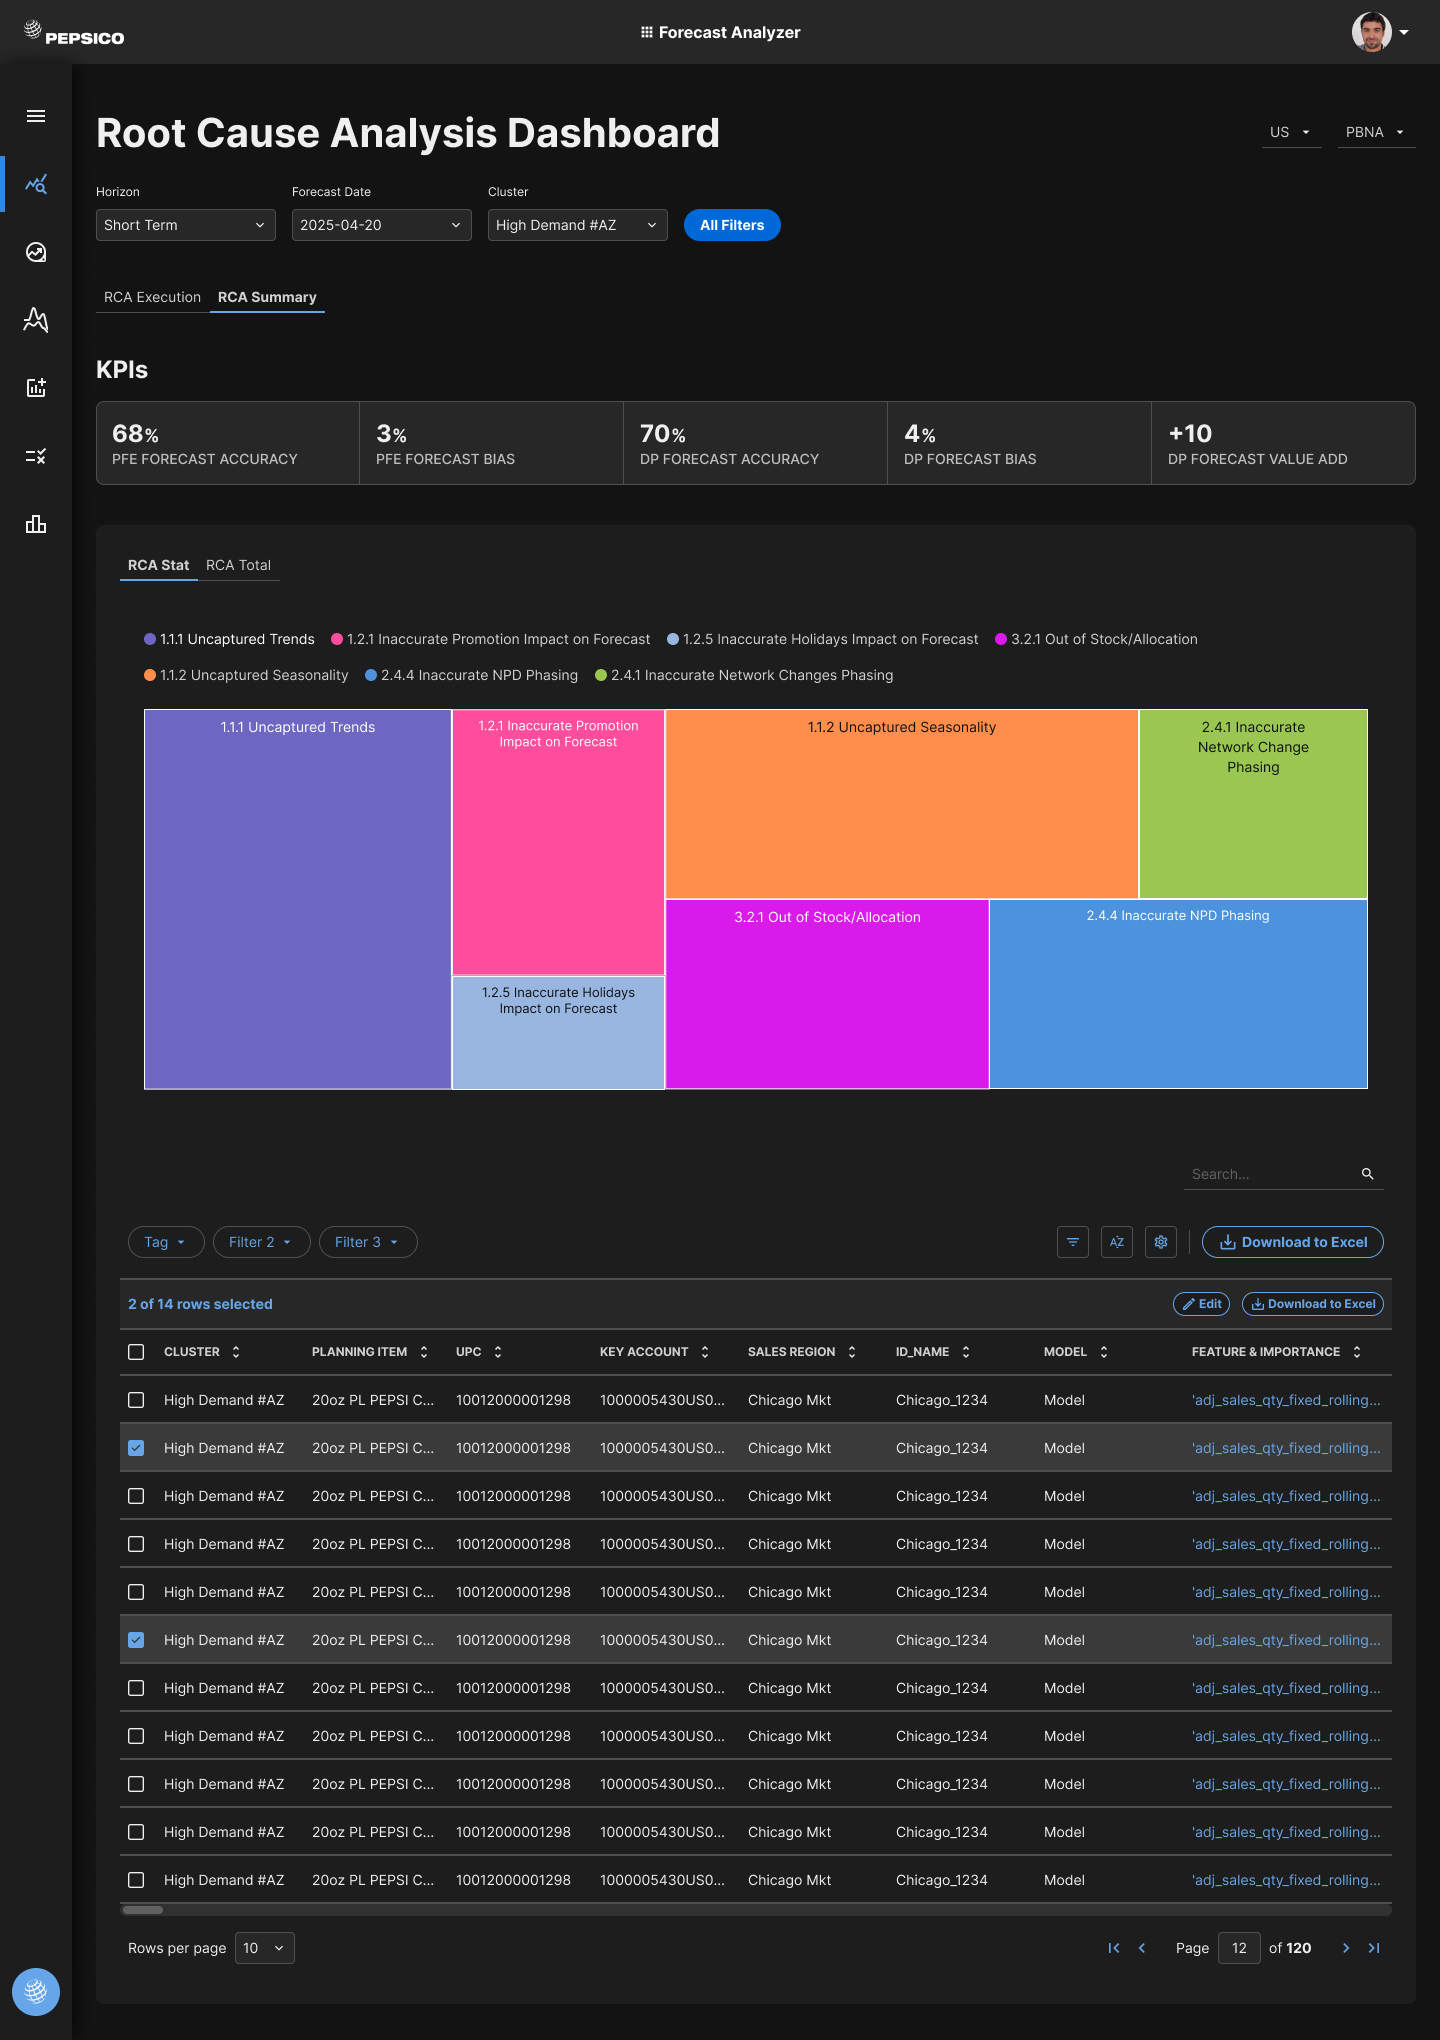
Creating Forecast Analysis UI (FA UI) removes this dependency and allows Forecast Analysts to work more efficiently and independently.

Data Scientists can focus on model enhancement rather than routine tasks.

RESEARCH

Workflow Diagram showing dependency reduction

Workflow diagram illustrating how FA UI reduces dependency between Forecast Analysts and Data Scientists

Data Scientist

A Data Scientist owns the forecasting models and logics in the PFE and enhances models and capabilities based on Forecast Analysis feedback to support forecast improvement.

Forecast Analyst

A Forecast Analyst ensures the driver-based forecast quality and drives its continuous improvement by adjusting forecast engine configuration and working with Data Scientists and Demand Planners.

→ PAIN POINTS

  • Bottleneck dependency: Forecast Analysts cannot proceed with their work until Data Scientists complete requests
  • Limited autonomy: Analysts understand what they need but can't execute it themselves
  • Inefficient resource use: Data Scientists spend time on routine tasks instead of model enhancement
  • Delayed improvements: Forecast quality improvements are delayed by dependency chains

→ KEY INSIGHT

Forecast Analysts have the domain knowledge to make decisions but lack the technical interface to execute experiments and analyses.

By creating a self-service tool that abstracts the complexity while maintaining the power, we could enable independence without requiring Data Scientist intervention for routine tasks.

SOLUTION

Forecast Analysis UI (FA UI) is a web application that enables Forecast Analysts to independently run experiments, analyze forecast data, and make configuration adjustments without requiring Data Scientist intervention.

The solution provides a user-friendly interface that abstracts the underlying complexity while maintaining the analytical power Forecast Analysts need.

This empowers them to work autonomously while freeing Data Scientists to focus on model enhancement and strategic improvements.

Results Visualization

→ KEY FEATURES

Experiment Request Interface

A structured interface that allows Forecast Analysts to request and configure experiments without needing to understand the underlying technical implementation.

Experiment Request Interface

Data Analysis Tools

Self-service data visualization and analysis capabilities that enable Forecast Analysts to explore forecast data and identify improvement opportunities independently.

RCA Visualization

Configuration Management

Tools for adjusting forecast engine configuration that abstract complexity while maintaining the flexibility Analysts need to optimize forecasts.

Reallocate DFU

REFLECTION

→ CHALLENGES

Balancing simplicity with functionality was challenging. Forecast Analysts needed powerful tools but couldn't handle the complexity that Data Scientists work with.

Finding the right level of abstraction required careful consideration of what to expose and what to hide.

Working with complex data visualization requirements while maintaining usability required multiple iterations and close collaboration with both user groups to ensure the solution met everyone's needs.

→ WHAT I LEARNED

This project taught me the importance of understanding the full ecosystem before designing. The dependency problem wasn't just about tools—it was about workflow, communication, and resource allocation.

Solving it required thinking about how both teams work, not just one.

Designing for domain experts who aren't technical experts requires careful abstraction. The challenge is maintaining the power they need while hiding complexity they don't need to understand. This project reinforced that good UX for internal tools is just as important as consumer-facing products.

Let's Connect!